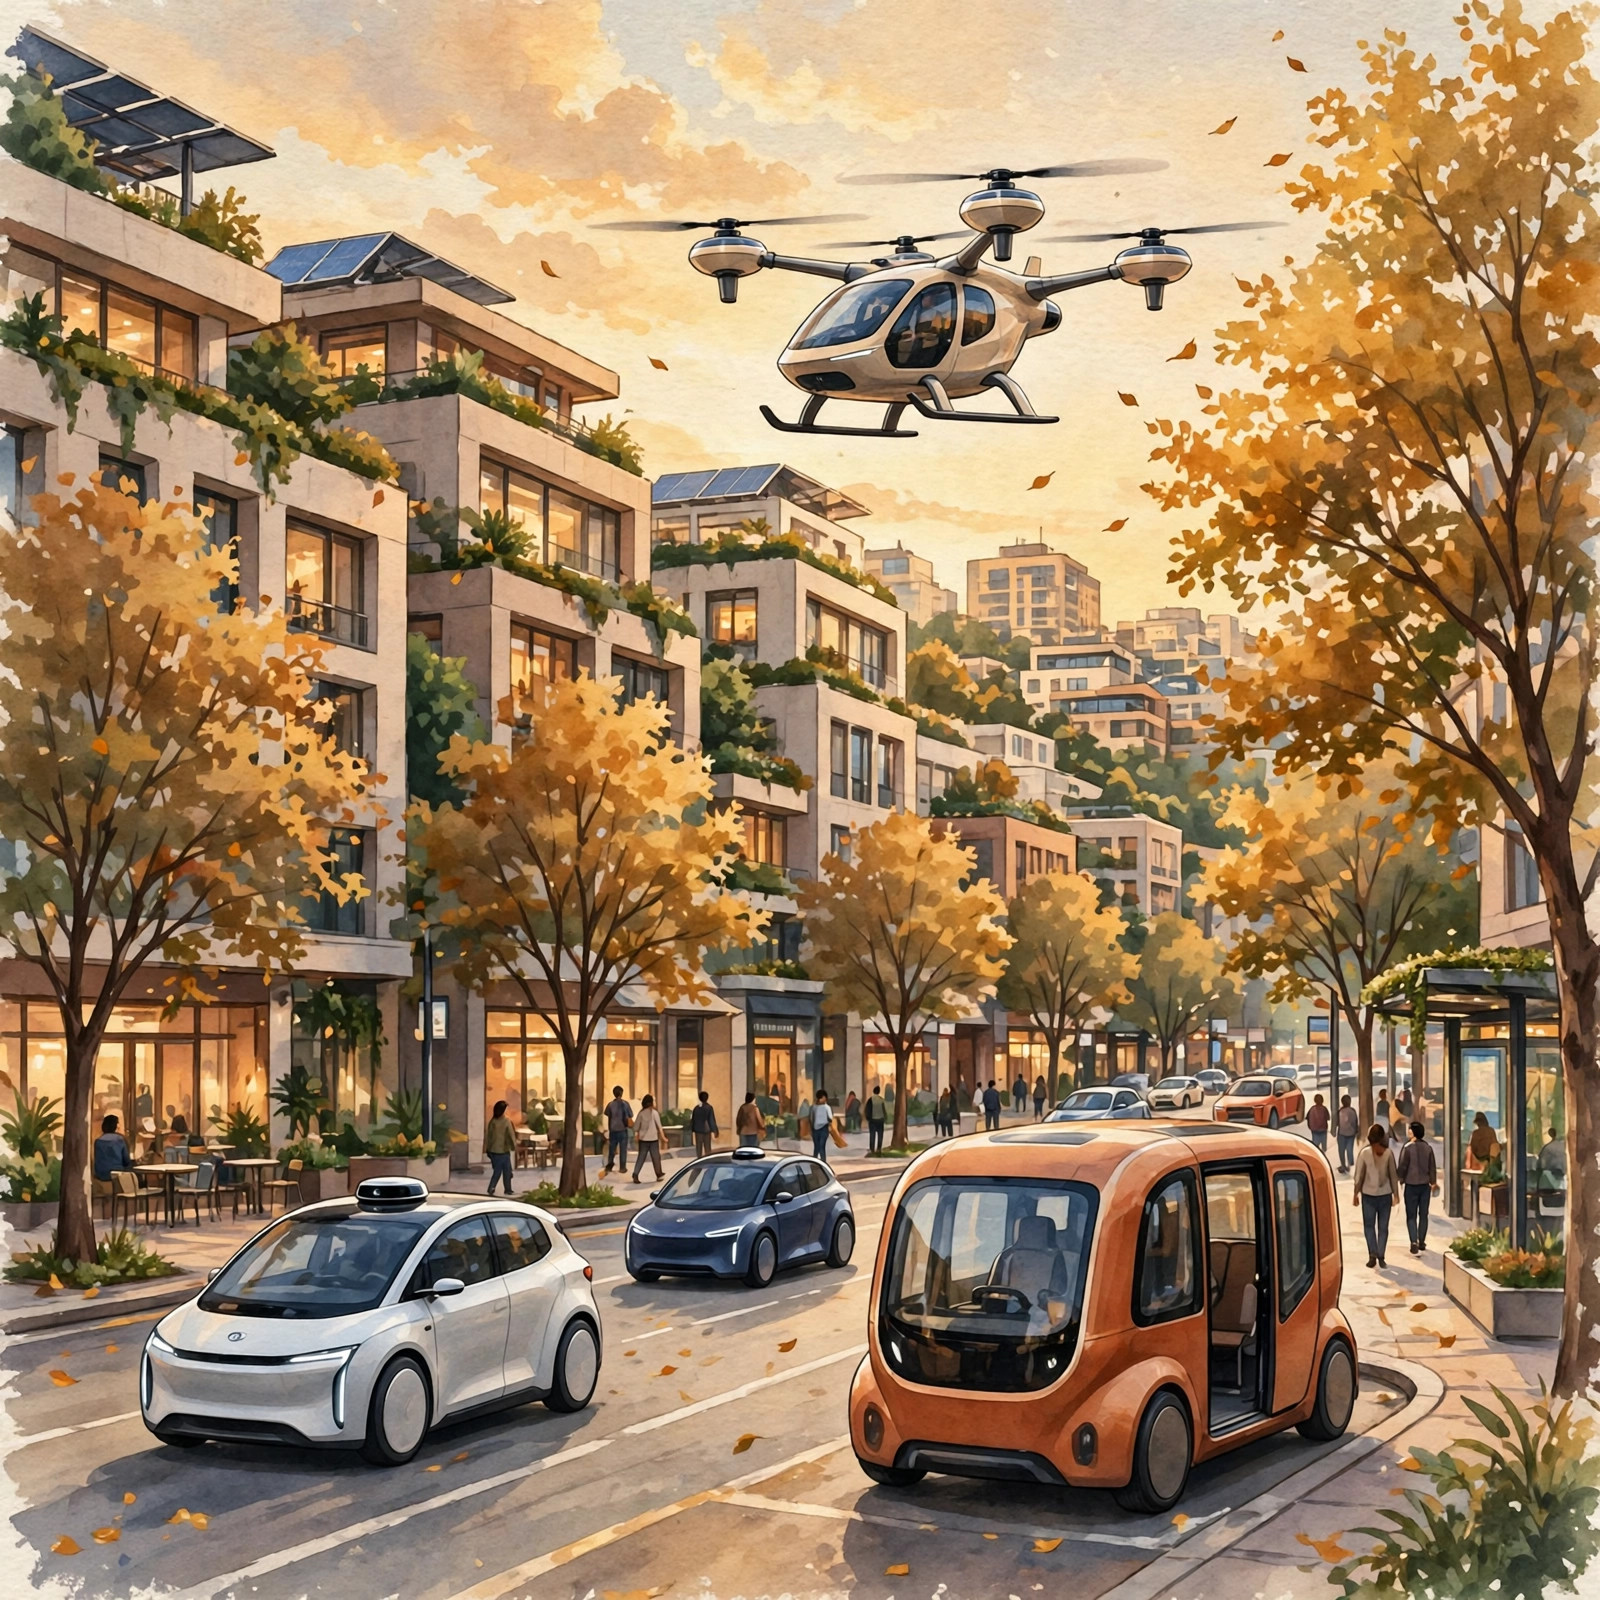
Hi, this is DatumDraft. Most conversations about the future of transportation stall out at surface-level science fiction. We hear endless speculation about flying cars or sleeping in the backseat on the highway, yet almost nobody breaks down the actual unit economics. If you work in automotive strategy, manage capital, or follow tech markets, you need hard numbers: who captures the margin, what happens to asset utilization, and how the balance sheet of a traditional automaker survives when private car ownership stops growing.
By 2040, the global mobility sector will look less like an industrial manufacturing race and much more like a utility and cloud infrastructure market. According to multi-scenario modeling from the McKinsey Center for Future Mobility, S&P Global Mobility, and Goldman Sachs Global Investment Research (as of Q4 2026 baselines), traditional one-time vehicle sales will shrink to less than 40% of the industry’s total revenue pool by 2040. The remaining 60% will come from autonomous ride-hailing, B2B2C Purpose-Built Vehicle (PBV) spatial subscriptions, Urban Air Mobility (UAM) corridors, and Software-Defined Vehicle (SDV) data and compute monetization.
Executive Thesis (2040 Mobility Outlook): Global annual new light-vehicle unit sales will plateau around 100 million units post-2035. However, total industry revenue will expand toward $9.5 trillion to $10.5 trillion by 2040 as revenue shifts from hardware transactions to recurring revenue per mile. The winners will be the operators that push autonomous operating costs below $0.40 per mile while keeping fleet utilization above 60%.
1. The Structural Shift: From Selling Metal to Monetizing Miles
For over a century, the automotive business model relied on a simple equation: build a factory, bend sheet metal, sell the vehicle to a dealer or consumer, and collect occasional high-margin revenue on replacement parts. Under that model, a private passenger car sits parked roughly 95% of its lifetime. It is one of the most capital-inefficient consumer assets ever created.
That inefficiency creates the exact economic opening that breaks the traditional dealership-and-ownership cycle between 2026 and 2040. As Level 4 (L4) autonomous driving systems mature and dedicated autonomous shuttles scale production, the cost per mile of shared autonomous transport drops below the cost per mile of owning and operating a personal car.
| Metric / Segment | 2026 Baseline (Current) | 2032 Mid-Term Forecast | 2040 Maturity Forecast |
|---|---|---|---|
| Global Annual New Car Sales | 91.5 Million Units | 97.0 Million Units | 99.5 Million Units (Plateau) |
| L4+ Autonomous Share of New Sales | Under 1.5% (Pilot Fleets) | 14% to 18% | 42% to 46% |
| Private Car Cost Per Mile (TCO) | $0.78 / mile | $0.72 / mile | $0.68 / mile |
| Robotaxi / Shared Autonomous ($/mile) | $1.65 / mile (Safety ops & R&D) | $0.58 / mile (Crossover point) | $0.36 / mile |
| One-Time Hardware Sales Share of Revenue | 76% of Industry Pool | 58% of Industry Pool | 37% of Industry Pool |
| Recurring Mobility, SDV & PBV Share | 24% of Industry Pool | 42% of Industry Pool | 63% of Industry Pool |
Look closely at the cost-per-mile crossover row in the table above. In late 2026, taking a human-driven ride-hail vehicle in a major US or European city costs roughly $2.10 to $2.80 per mile. Early commercial autonomous fleets (such as Waymo One operating across San Francisco, Phoenix, Los Angeles, and Austin, or Baidu Apollo Go in Wuhan) have eliminated the human driver wage, but their per-mile cost remains elevated around $1.40 to $1.80 due to small-batch sensor assembly, remote fleet assistance centers, and localized depot overhead.
Once purpose-built autonomous vehicles—built without steering wheels, pedals, or legacy cockpit crashes structures, and running on unified system-on-chip (SoC) architectures—reach mass production scale of 500,000+ units per year, unit hardware BOM drops below $25,000. When a $25,000 electric autonomous pod operates 14 to 18 hours a day (60% to 75% utilization) over a 500,000-mile commercial battery lifespan, fixed depreciation shrinks to $0.05 per mile. Add commercial fleet electricity, automated depot cleaning, tires, and cloud telematics, and the fully loaded operating cost lands at $0.35 to $0.40 per mile by 2040. At that price, buying a $45,000 second family car for suburban commuting stops making financial sense.
2. The 2040 Market Map: Four New Revenue Pillars and Their Economics
When hardware sales flatten out, where does the growth go? The $6.4 trillion in non-traditional revenue projected for 2040 concentrates across four distinct verticals. Each vertical operates with its own capital expenditure profile, regulatory bottleneck, and competitive moat.
Market 1: Robotaxi and Autonomous Shared Fleets ($1.5T to $1.8T by 2040)
Robotaxi services look like software businesses on the surface, but they scale like heavy infrastructure utilities. A winning operator needs four layers working together: an L4 autonomous driving stack validated across edge cases, low-cost vehicle hardware designed for 500,000-mile durability, a consumer demand-aggregation network, and physical depot infrastructure for high-speed automated charging and cabin turnaround.
The core moat here is fleet utilization paired with density. If a robotaxi sits idle during midday hours, its fixed depreciation per active mile doubles. Operators that blend passenger ride-hailing during peak commute hours (7:00 AM to 9:30 AM and 4:30 PM to 7:30 PM) with off-peak B2B parcel logistics and night-time retail restocking can push vehicle utilization past 80%. High utilization drives down per-mile pricing, which attracts more riders, which further increases network density and reduces deadhead (empty) miles below 15%.
Market 2: Purpose-Built Vehicles (PBV) and B2B2C Spatial Subscriptions ($1.1T to $1.4T by 2040)
Once the driver seat disappears and the powertrain flattens into an electric skateboard chassis (battery pack, drive motors, and steer-by-wire integrated below the floor), the upper cabin becomes decoupled real estate. This is the core engineering premise behind Purpose-Built Vehicles (PBVs).
Instead of selling a standard van to a logistics company, OEMs in 2040 lease modular autonomous chassis with swappable or custom-configured cabin pods on multi-year B2B2C contracts. Consider three concrete commercial setups:
- Mobile Healthcare & Diagnostic Pods: Hospital networks subscribe to fleets of autonomous medical PBVs equipped with portable ultrasound, blood-draw robotics, and telemedicine links. Rather than patients commuting to a clinic, the clinic parks outside a residential complex for 45 minutes.
- On-Demand Retail & Cold-Chain Showroom PBVs: Grocery chains and luxury retailers deploy climate-controlled showroom pods that route dynamically to high-demand neighborhoods based on real-time app orders.
- Mobile Enterprise Workspaces: Corporate fleets lease soundproof, satellite-connected conference pods so executives or engineering teams can conduct four-hour regional transits as uninterrupted work sessions.
Market 3: Urban Air Mobility (UAM) and Regional eVTOL Corridors ($850B to $1.2T by 2040)
Electric Vertical Take-Off and Landing (eVTOL) aircraft—developed by players like Joby Aviation, Archer Aviation, Supernal (Hyundai Motor Group), and Eve Air Mobility—spend the late 2020s clearing FAA, EASA, and CAAC type certifications and running premium airport-to-city-center shuttles. By 2040, solid-state battery energy density surpassing 400 Wh/kg unlocks 150-to-250-mile regional routes with rapid 15-minute turnaround charging.
However, the highest operating margins in the 2040 UAM ecosystem will not belong to the aircraft manufacturers. They will belong to the owners of Vertiports and low-altitude airspace slot rights. Just as Heathrow or JFK airport slot allocations dictate airline profitability, urban rooftop vertiports with high-megawatt grid interconnects and automated air traffic management (UTM) systems will become prime commercial real estate assets charging takeoff, landing, and kilowatt-hour throughput fees.
Market 4: SDV Subscriptions, Biometric Commerce, and Decentralized Vehicle Compute ($650B to $850B by 2040)
By 2040, every modern vehicle operates on a centralized zonal E/E (Electrical/Electronic) architecture powered by liquid-cooled automotive supercomputers delivering 2,000 to 5,000 TOPS (Tera Operations Per Second) of AI inference capacity. That creates two distinct cash flows:
- OTA Feature & Environment Subscriptions: Hardware is standardized at the factory to cut assembly complexity. Customers or fleet riders pay per-trip or monthly fees to unlock specialized suspension damping profiles, immersive AR windshield workspaces, or level-4 highway-to-door autonomy.
- Idle Vehicle Compute Leasing (Decentralized Edge Cloud): Even in 2040, tens of millions of privately owned and commercial vehicles will spend 8 to 12 hours a day plugged into bidirectional V2G (Vehicle-to-Grid) chargers inside parking structures. When plugged into power and fiber/5G-Advanced/6G backhaul, an idle car’s onboard neural processing units (NPUs) don’t need to sit dark. Automakers will pool millions of parked vehicles into a distributed edge-computing grid, renting out localized AI inference and rendering capacity to enterprise cloud buyers while sharing revenue (or offsetting electricity bills) with the vehicle owner.
3. The 2040 Product Catalog: What Consumers Subscribe to Instead of Buying
How does this structural shift feel to an everyday household in 2040? Private vehicle ownership will not vanish entirely—rural residents, outdoor enthusiasts, and ultra-luxury buyers will still purchase personal vehicles—but for the 65% of the global population living in metropolitan regions, buying a depreciating metal box with a 60-month auto loan will look archaic.
Instead, households allocate their monthly transportation budget across four recurring product tiers:
- Product 1: Multi-Modal “Mobility-as-a-Bundle” Subscriptions ($350 to $950/month): Similar to telecom family plans or streaming bundles, a household subscribes to a guaranteed monthly mileage quota (for example, 1,500 miles/month). On Tuesday morning, the subscription dispatches a single-occupant commuter pod to the train station. On Friday evening, it summons a 6-seat autonomous lounge PBV for a family weekend trip. On Monday morning, it books an eVTOL seat for an urgent cross-bay airport transfer.
- Product 2: Autonomous Lease-Back (“Yield-Generating Private Vehicles”): For consumers who still prefer owning a personal vehicle for hygiene, privacy, or customization, the vehicle functions as a yield-generating asset. You take your autonomous SUV to work at 8:30 AM. Instead of paying $400 a month to park it in a downtown garage, you tap “Deploy to Fleet” on your smartphone. The car spends 9:00 AM to 5:00 PM completing autonomous passenger trips or high-margin pharmacy deliveries, returning to your office curb at 5:15 PM with a sanitized interior and net daily earnings credited against your monthly lease payment.
- Product 3: Micro-UAM Hoppers and Autonomous Last-Mile Delivery Lockers: E-commerce delivery shifts away from human couriers double-parking diesel vans. Sidewalk-grade autonomous locker robots and drone micro-hubs sync directly with residential building smart-locks, delivering groceries and parcels during low-traffic overnight windows (1:00 AM to 5:00 AM) at a fraction of current last-mile logistics costs.
- Product 4: Overnight Sleeper PBVs (“Rolling Hospitality”): Why burn four hours of daylight at an airport for a 350-mile regional trip (such as Los Angeles to San Francisco, Seoul to Busan, or Munich to Milan)? In 2040, travelers summon a soundproofed, flat-bed sleeper PBV at 11:30 PM, sleep in a hotel-grade cabin while the vehicle cruises smoothly on dedicated autonomous highway lanes at 65 mph, and wake up parked directly outside their morning meeting venue at 6:30 AM—combining intercity transit and a night’s hotel stay into a single fee.
| 2040 Consumer Product Tier | Target User Persona | Estimated Monthly / Usage Pricing (2026 USD Equiv.) | Primary Value Proposition vs. Legacy Ownership |
|---|---|---|---|
| Commuter Core Pass (Shared Pod) | Urban singles, students, daily metro commuters | $280 – $420 / month (up to 800 miles) | Eliminates insurance, parking fees ($250+/mo), and maintenance shock |
| Family Flex Bundle (Multi-Cabin Access) | Suburban/urban families with children | $650 – $1,100 / month (1,800 miles + dynamic vehicle swap) | Replaces owning two separate cars (sedan + 3-row SUV) with on-demand fleet sizing |
| Private Autonomous Lease-Back | Suburban owners wanting dedicated personal cabin | $750 / mo gross lease minus $350–$500 fleet & NPU compute credits | Personal storage & customization retained while monetizing 90% idle daytime hours |
| Overnight Sleeper PBV & Exec Lounge | Business travelers, regional weekend tourists | $180 – $320 per overnight intercity route | Replaces short-haul flight + airport transfer + 1-night business hotel cost |
4. Competitive Landscape: 2040 Survival Scenarios for Incumbent Giants
The transition from hardware sales to autonomous mobility networks will trigger brutal consolidation. Manufacturing 10 million internal combustion or basic electric cars per year will not save an automaker if those cars are sold at a 4% operating margin to third-party platform giants who capture the 30% margin on software, fleet routing, and in-cabin commerce.
Let’s evaluate the six major power blocs—Tesla, Hyundai Motor Group, Toyota, BYD, the Huawei/Xiaomi Chinese tech alliance, and Alphabet’s Waymo—based on their current 2026 balance sheets, engineering stacks, and structural vulnerabilities.
1. Tesla: The End-to-End Neural Network & Unboxed Manufacturing Bet
- Core Assets (2026 Baseline): Over 6 million FSD-capable vehicles collecting real-world video training clips globally; massive proprietary AI training compute clusters (Cortex); vertical integration across Megapack energy storage, Supercharger infrastructure, and low-cost “Unboxed” assembly architecture developed for the dedicated 2-seat Cybercab.
- Structural Vulnerability: Heavy reliance on a vision-only (camera-only) neural network approach creates regulatory friction in jurisdictions demanding redundant LiDAR/radar safety architectures for driverless commercial certification.
- 2040 Survival Scenario: If Tesla proves that vision-only end-to-end AI achieves 10x human safety levels without expensive LiDAR arrays, its hardware BOM advantage will let it flood major cities with $20,000–$25,000 Cybercabs operating alongside privately owned Teslas in a unified Tesla Network. If vision-only hits an edge-case ceiling in severe weather or complex urban zones, Tesla will be forced to retrofit multi-modal sensors, compressing its hardware cost lead.
2. Hyundai Motor Group (HMG): The Full-Spectrum Physical AI & PBV Integrator
- Core Assets (2026 Baseline): Top-3 global manufacturing volume coupled with aggressive physical diversification: dedicated Kia PBV factories (Evo Plant in Hwaseong producing PV5/PV7), SDV software standardization (42dot / Pleos architecture), Boston Dynamics (Atlas humanoid & Stretch logistics robotics), Supernal (eVTOL), and autonomous foundry partnerships (supplying custom Ioniq 5 fleets to Waymo while developing Motional).
- Structural Vulnerability: Managing capital allocation across simultaneous multi-billion-dollar bets (EVs, hybrids, hydrogen, PBVs, robotics, and UAM) while competing against pure-play software giants for top AI talent.
- 2040 Survival Scenario: HMG is uniquely positioned to become the “TSMC + Physical Infrastructure Backbone” of 2040 mobility. Even if Waymo or another tech giant dominates consumer ride-hailing algorithms in certain regions, HMG wins by supplying the purpose-built autonomous PBV skateboards, operating the eVTOL vertiport networks via Supernal, and deploying Boston Dynamics robots for automated factory assembly and last-mile parcel unloading.
3. Waymo (Alphabet) & Zoox (Amazon): The “Android of Autonomous Mobility”
- Core Assets (2026 Baseline): Waymo holds the undisputed Western lead in commercial, fully driverless L4 urban miles (surpassing hundreds of thousands of paid weekly trips across multiple US metro areas by late 2026 with its 6th-generation hardware suite). Backed by Alphabet’s balance sheet, DeepMind AI research, Google Maps routing, and Android ecosystem integration.
- Structural Vulnerability: Zero in-house vehicle manufacturing capacity. Waymo relies on external OEMs (Geely/Zeekr, Hyundai, Magna) to build and assemble the physical vehicles, exposing it to geopolitical tariff walls and hardware supply bottlenecks.
- 2040 Survival Scenario: Waymo does not want to run low-margin stamping presses. By 2040, Waymo licenses the “Waymo Driver” hardware-and-software stack to legacy automakers and logistics operators globally—taking a high-margin per-mile royalty and controlling the in-cabin digital ad/entertainment ecosystem, effectively replicating Google’s Android playbook inside the automotive industry.
4. BYD: The Ruthless Vertical Integration & Emerging Market Hegemon
- Core Assets (2026 Baseline): Complete ownership of the battery supply chain (Blade LFP batteries, lithium refining, power semiconductors, electric motors, and dedicated roll-on/roll-off ocean car carriers). BYD can engineer and manufacture an electric vehicle 25% to 30% cheaper than Western or Japanese peers.
- Structural Vulnerability: Historically lagged top-tier software players in high-level urban autonomous driving (though catching up rapidly via its “God’s Eye” DiPilot ADAS rollout and partnerships with Huawei and DJI) and faces steep protectionist tariff barriers in the US and EU.
- 2040 Survival Scenario: BYD dominates the hardware layer across Latin America, Southeast Asia, the Middle East, Africa, and China. By driving electric autonomous shuttle hardware costs below $15,000 per unit, BYD becomes the indispensable fleet supplier for municipal transit agencies and developing-market ride-hailing networks worldwide.
5. Huawei (Harmony Intelligent Mobility Alliance – HIMA) & Xiaomi
- Core Assets (2026 Baseline): Huawei does not manufacture cars under its own badge, yet its Qiankun ADS autonomous driving system and HarmonyOS smart cockpit already power premium Chinese brands (AITO, Luxeed, Stelato, Maextro) and even joint ventures with foreign OEMs like Audi in China. Xiaomi brings seamless consumer IoT (“Human x Car x Home”) ecosystem lock-in.
- Structural Vulnerability: Geopolitical restrictions limit direct expansion into North American passenger markets and restrict access to Western sub-3nm semiconductor foundry nodes.
- 2040 Survival Scenario: Huawei becomes the Bosch + Continental + Nvidia of the Eastern Hemisphere and Belt-and-Road markets. State-owned and mid-tier automakers surrender their software and autonomous brains to Huawei in exchange for survival, allowing Huawei to extract software licensing and cloud service fees without carrying factory depreciation on its own balance sheet.
6. Toyota Motor Corporation: The Prudent Cash Machine & Solid-State Dark Horse
- Core Assets (2026 Baseline): Unmatched global scale (10+ million annual units), industry-leading free cash flow generated by dominant hybrid (HEV) demand, the Toyota Production System (TPS), Arene OS development, Woven City living laboratory, and the largest patent portfolio in sulfide-based all-solid-state batteries (partnered with Idemitsu Kosan).
- Structural Vulnerability: Organizational conservatism and a massive legacy supplier pyramid in Japan tied to internal combustion drivetrains slow down radical software-first restructuring.
- 2040 Survival Scenario: Toyota uses its massive hybrid cash flows between 2026 and 2032 as a defensive shield while pure-EV startups burn through capital. In the 2030s, if Toyota successfully commercializes 750-mile solid-state batteries with 10-minute charge times, it can leapfrog standard lithium-ion fleets and deploy ultra-high-uptime autonomous e-Palette PBV ecosystems.
| Player | Primary 2026 Competitive Moat | Key Strategic Risk | Dominant 2040 Business Model | 2040 Survival Verdict |
|---|---|---|---|---|
| Tesla | End-to-end FSD data scale + Unboxed manufacturing + Energy grid | Vision-only regulatory hurdles in strict L4 jurisdictions | Vertically integrated Robotaxi network + AI/Humanoid compute | Tier-1 Ecosystem Titan (High margin, high volatility) |
| Hyundai Motor Group | Modular PBV platforms (eM/eS) + Robotics (Boston Dynamics) + UAM | Capital intensity across multi-modal hardware verticals | B2B2C PBV spatial provider + Autonomous Foundry + UAM infra | Tier-1 Physical Mobility Backbone |
| Waymo (Alphabet) | Proven commercial L4 safety record + Google AI/Cloud stack | Lack of in-house vehicle manufacturing scale | Global L4 OS licensor + Fleet network operator (“Android of Auto”) | Tier-1 Software & Network Hegemon |
| BYD | Unbeatable battery-to-chassis vertical integration & cost floor | Western tariff walls + software branding outside China | Global low-cost EV/PBV hardware supplier & Global South leader | Tier-1 Hardware Scale Leader |
| Huawei / Xiaomi | HarmonyOS ecosystem lock-in + Qiankun ADS + 5G/6G V2X | Western geopolitical & semiconductor sanctions | Tier-0.5 Intelligent Automotive Solution Provider & IoT ecosystem | Dominant Asian & EM Tech Platform |
| Toyota | Hybrid cash cow + Global distribution + Solid-state battery IP | Slow transition to pure software-defined organizational culture | High-durability fleet hardware + Next-gen battery platform | Resilient Incumbent Survivor |
5. How Consumers & Enterprises Decide in 2040: Decision Architecture & Weekly Matrix
To understand how revenue migrates between these companies, we have to look at how an individual or corporate fleet manager actually selects transportation in 2040. The decision is no longer “Which car brand do I buy?” Instead, an AI personal assistant routes every trip based on real-time cost per mile, urgency, cabin privacy needs, and cargo volume.
To make this concrete, below is a visual planner showing how a single dual-income urban/suburban household interacts with the mobility stack across a standard week in 2040 without owning a traditional single-purpose sedan.
6. Troubleshooting 2040: Structural Friction and the Dark Side of Autonomous Mobility
Any serious strategic forecast has to reject naive technological determinism. A world where autonomous fleets handle 60% of urban passenger miles creates severe secondary shocks across labor markets, municipal budgets, and regional equity.
1. The Urban-Rural Mobility Divide
Robotaxi unit economics depend entirely on passenger density and high daily utilization. In Seoul, Tokyo, London, San Francisco, or Shanghai, an operator can keep a vehicle active 16 hours a day with minimal empty miles. In rural counties or shrinking agricultural towns, trip density is too low to justify localized autonomous depot infrastructure and high-definition V2X maintenance. While metropolitan residents enjoy $0.38-per-mile on-demand transit, rural populations risk facing higher insurance premiums on legacy human-driven vehicles and shrinking access to physical service centers.
2. Collapse of the Legacy Aftermarket, Insurance, and Municipal Revenue
Three massive economic ecosystems depend on human driving errors and internal combustion complexity:
- Auto Insurance & Collision Repair: Over 90% of road accidents involve human distraction, fatigue, or impairment. As L4 fleets cut collision rates by 80%+, personal auto insurance premiums implode, shifting into B2B product-liability and cybersecurity underwriting between OEMs and software providers. Independent body shops face existential consolidation.
- Municipal Traffic & Parking Revenue: American and European city budgets rely heavily on parking meter fees, municipal garages, traffic citations, and fuel taxes. Autonomous vehicles don’t get speeding tickets and rarely park in prime downtown curbsides. Cities will inevitably replace fuel taxes and parking fines with dynamic per-mile congestion and curb-access pricing, particularly targeting empty “zombie” autonomous vehicles circulating to avoid parking fees.
- Commercial Driving Labor Displacement: Taxi drivers, ride-hail drivers, and long-haul trucking operators represent millions of middle-income jobs globally. While new technical roles will emerge in remote fleet supervision, automated depot maintenance, and vertiport operations, the geographic and skill mismatch will trigger intense union resistance and regulatory quotas throughout the 2030s.
3. Cybersecurity, Grid Bottlenecks, and Edge-Case Liability
When a city’s entire morning commute and hospital logistics run on three or four centralized software stacks, a corrupted OTA update, a coordinated state-sponsored cyberattack, or a localized power grid failure stops being an inconvenience—it becomes a national security freeze. Regulators in the 2030s will regulate dominant mobility operating systems with the same strict redundancy mandates applied to nuclear power plants and commercial aviation.
7. Strategic Takeaways for Practitioners and Investors
The automotive industry between 2026 and 2040 is undergoing a full-stack inversion. In the 20th century, software and electronics were low-cost components bolted onto a high-value mechanical powertrain. By 2040, the mechanical skateboard is the standardized commodity, and the autonomous AI stack, fleet utilization network, and modular spatial ecosystem capture the overwhelming majority of economic value.
Whether you are evaluating long-term equity positions or planning corporate product roadmaps, keep three metrics front and center over the next decade: fully loaded cost per autonomous mile ($/mile), daily commercial asset utilization (%), and recurring revenue per active chassis. The manufacturers that still measure success solely by how many metal boxes roll off the assembly line in a calendar year are optimizing for a market that has already peaked.
How do you see your own commute or household car ownership changing over the next decade? Would you give up owning a second car if an autonomous pod arrived in under two minutes at $0.40 a mile, or do you still prefer owning your own space? Drop your thoughts in the comments below, and share this breakdown with anyone following the future of mobility and tech strategy.
Sources
- McKinsey Center for Future Mobility
- Goldman Sachs Global Investment Research
- S&P Global Mobility
- Roland Berger
- PwC Autofacts
- Corporate filings (as cited in the article)
Market size figures in this article are a DatumDraft synthesis based on the sources above (November 2026 baseline). No single report URL covers the full set, so individual reports are listed by publisher rather than linked.